What a census of commercial establishments reveals about economic activity in a secondary city
Despite being a pillar in Malawi’s long-term development vision under MW2063, including the launch of Secondary Cities Development Plan in 2022, relatively little attention is being paid to urbanization and secondary cities and how they can be leveraged for inclusive development. Overall, urbanization rates remain low, and relatively few people live in large towns and cities compared to other countries in the region. According to the United Nations World Urbanization Prospects 2025, Malawi remains one of the least urbanized countries globally, with most of its urban population residing in smaller towns. To improve our understanding of the economic activities and opportunities in Malawian secondary cities, we conducted a census of commercial establishments in the town center of Kasungu Boma. The aim of this exercise was to generate a detailed picture of commercial activity in Kasungu by systematically documenting all establishments within the defined study area.
Between 14 and 21 May 2025, a team of nine enumerators walked every street within a pre-defined area of Kasungu, mapping all visible commercial establishments, their exact activity, size, and level of formality as proxied by the construction materials used—ranging from more permanent brick structures to more informal setups made of wooden poles and straw for example.. In total, 2,787 commercial establishments were enumerated.
Defining the “center” of Kasungu
A first challenge was defining where “urban” Kasungu begins and ends. As is often the case, administrative boundaries for Kasungu Boma do not capture urbanization or urbanicity well. When overlaid with maps delineating urban agglomerations based on built-up area (Africapolis) or population size and density thresholds (Degree of urbanization), some inconsistencies become apparent.
Figure 1. Delineating Kasungu town
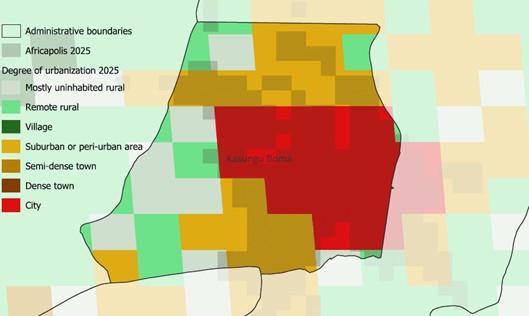
Instead of relying on administrative definitions, we defined the center using natural and infrastructural boundaries: the Chitete River, and the M1 and M18 roads. Based on visual inspection, this area captures the core of commercial and economic activity more accurately than existing administrative units.
Figure 2. Defining the center of urban Kasungu using natural and road boundaries
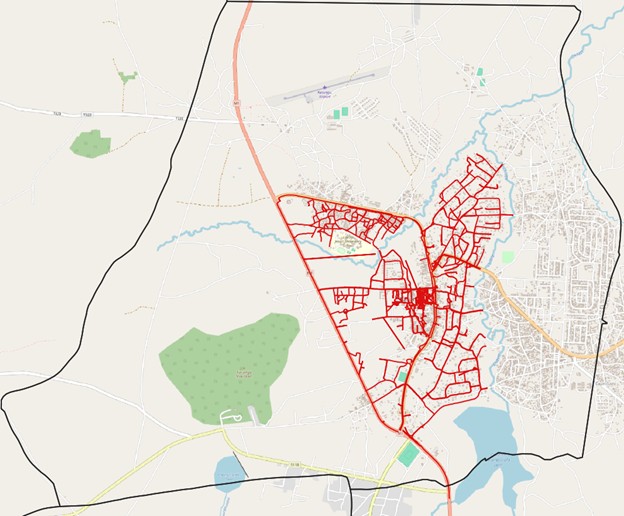
Note: The red lines represent the routes traversed by enumerators. Each route corresponds to streets and pathways systematically covered by enumerators as they recorded all commercial establishments within the study area.
This decision matters. How we define cities shapes how we measure them, and in turn how evidence feeds into urban policy and investment decisions.
What counts as a commercial establishment?
Given the importance of informality in Malawi’s urban economy, this census was not restricted to registered or licensed businesses. Our aim was to capture the full spectrum of commercial activity.
For the purpose of this exercise, a commercial establishment was defined as a fixed structure where commercial activities, either the production of goods intended for sale, or the sale of goods or services, are visibly taking place.
The guiding principle was stability and permanency. Structures had to be fixed, have a roof of any material, and host visible commercial activity. Mobile operations were excluded. Mobile hawkers or open spaces functioning as car workshops were, for example, not counted in the absence of any roofed structure. By contrast, even simple market stalls constructed from wooden poles and a thatched roof were recorded.
Only activities visible from the outside were enumerated. Someone stitching garments inside their home for pay, for example, was not included. However, if that person had set up a permanent, roofed stall in front of their home, they were. Closed establishments were still recorded if closure appeared temporary and goods, services, or advertising were visible.
A retail‑dominated commercial economy
The census reveals a commercial landscape dominated by retail. More than half of all establishments (55 percent) engage in retail or wholesale activities.
Figure 3. Spatial distribution of commercial establishments in urban Kasungu
Clothing retail, largely driven by second-hand clothing, emerged as the single most common activity, with 429 establishments recorded. This was followed by restaurants, bars, and hospitality services (355), sale of agricultural produce (298), groceries (247), and ICT and electronics sales or repair (177).
Figure 4. Top 10 commercial activities by number of establishments
Beyond retail, Kasungu hosts a wide range of services and small-scale manufacturing activities, including vehicle repair, carpentry, tailoring, grain milling, brick making, and agro-input supply. While individually small in number, together these activities point to a localized production base that serves both urban consumers and surrounding rural areas.
Figure 5. Top 10 commercial activities by number of establishments, size and construction type
Size, sector, and informality
Enumerators were asked to estimate the size of each commercial establishment based on the storefront width. Most establishments in Kasungu are very small or small (57 %), with an estimated storefront width of less than 2 and between 2 and 4 meters respectively. This holds across all sectors. Micro-establishments are, however, relatively rarer in the service sector.
Figure 6. Commercial establishments by sector and size
While the informality or permanency of the construction and the size of the establishment are correlated, they do not overlap perfectly. Even though very small or micro‑establishments account for the highest share of informal structures, less permanent establishments were recorded in every size category, including medium and large establishments. Around half of the micro-establishments were more informal-looking constructions made of less permanent materials such as wood and straw, this was the case for only 18 per cent of small establishments, a portion comparable to that among medium and large establishments (21 %). Overall, about 23 percent of all mapped establishments were constructed from less permanent materials.
Figure 7. Distribution of establishments by size and construction type
Why this matters
This census provides a detailed snapshot of Kasungu’s commercial core at a specific point in time. Beyond documenting what exists, it allows us to ask deeper questions: How does commercial density evolve as towns grow? Do existing establishments become larger or diversify or do new establishments appear in less dense areas? Which activities cluster together, and where? How resilient are different businesses to economic shocks?
By repeating similar mapping exercises over time, or extending them to other towns, it becomes possible to track changes in urban economic structure, informality, and diversification. For policymakers and planners, such evidence is essential for designing infrastructure, market facilities, and regulatory frameworks aligned with how urban economies actually function.
Kasungu’s commercial landscape is vibrant, diverse, and deeply informal, but it is also structured in ways that can be measured, mapped, and better understood. This census offers a first building block toward that understanding.